Work Services AI Workshop Blog About Contact Book Free Consult

Capability Demonstration. This deck showcases Moor Graphix's AI-Powered Executive Presentation System methodology. All figures, KPIs, and the Q3 revenue example inside are illustrative and used to demonstrate the design process — not real client financials.

✦ Capability Demonstration✦ AI-Powered Presentation Design✦ Executive Communication✦ Visual Reasoning✦ Human-in-the-Loop AI✦ Brand Systems ✦ Capability Demonstration✦ AI-Powered Presentation Design✦ Executive Communication✦ Visual Reasoning✦ Human-in-the-Loop AI✦ Brand Systems
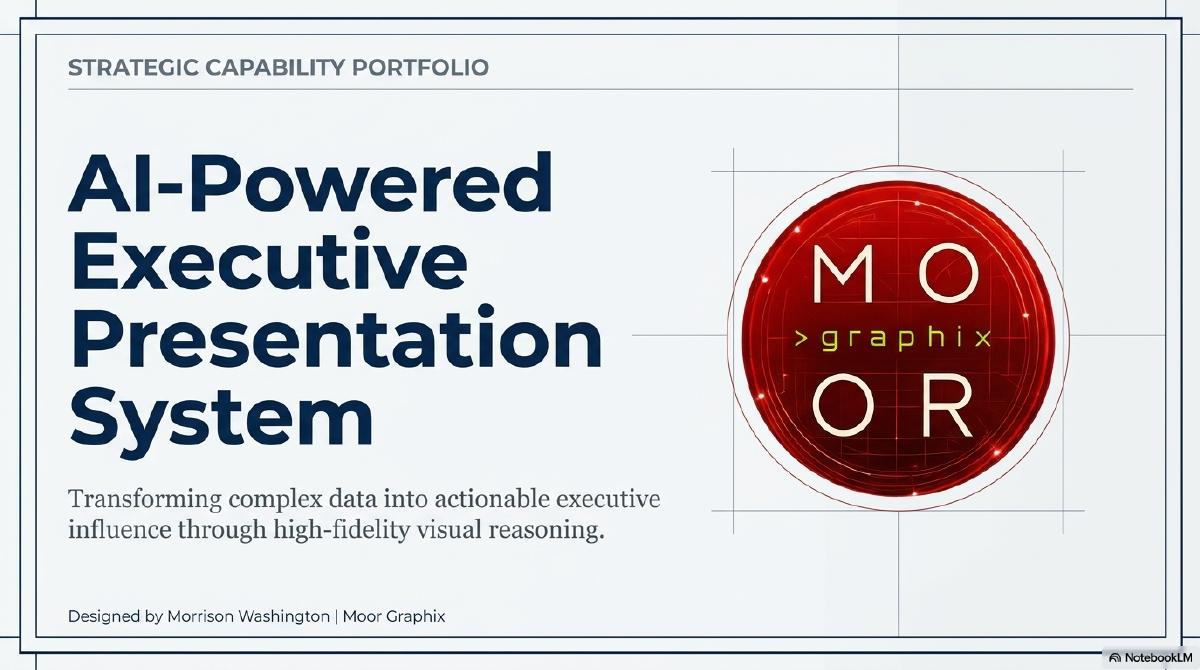
The Executive Blueprint — AI-Powered Executive Presentation System deck cover
Capability Demonstration — Strategic Capability Portfolio

The Executive Blueprint —
AI-Powered Presentation System

How Moor Graphix transforms raw data and AI output into board-ready visual reasoning: a human-in-the-loop presentation design system built on strict brand architecture, data-ink optimization, and a repeatable five-gate workflow. All figures and the Q3 revenue example inside are illustrative, built to demonstrate the design methodology — not real client financials.

FormatStrategic Capability Portfolio
Pages12
DisciplinesAI Workflow Design · Brand Systems · Executive Communication
StatusCapability Demo — Illustrative Data

The Problem

Raw generative AI output has created a crisis of clarity in executive communications.

Organizations now generate insights faster than ever with AI — yet executives spend more time synthesizing dense, unstructured summaries. Default AI presentation output lacks strategic nuance and brand fidelity, and misaligned decks directly correlate with elongated sales cycles and delayed decisions.

40%
Reduction in Executive Review Cycles
3x
Increase in Stakeholder Comprehension
100%
Brand Compliance Across Communications

The Methodology

Human-in-the-loop architecture — AI accelerates, humans govern.

Every deck moves through a five-stage pipeline, with a human quality gate at the center: Research (AI-heavy data scraping and trend synthesis), Analysis (AI structures raw data, a human strategist applies MECE frameworks), Recommendation (the human designer acts as the absolute filter), Implementation (AI-assisted layout and typography scaling), and Measurement (automated engagement tracking).

01

Research (AI Heavy)

Automated data scraping, pattern recognition, and initial trend synthesis via custom LLM prompts.

02

Analysis (Human + AI)

AI structures raw data; the human strategist applies MECE frameworks and challenges assumptions.

03

Recommendation (Human Quality Gate)

The human designer translates raw analytical findings into actionable, visually encoded insights — the absolute filter.

04

Implementation (AI Accelerated)

AI assists with macro-layout adaptation, color palette application, and typography scaling within the brand system.

05

Measurement (Automated)

Tracking slide engagement, read-times, and stakeholder interaction post-delivery.


The System

A rigid brand architecture signals institutional authority.

Typography (Inter for scannable objectivity, Lora for editorial authority), a locked navy/slate/crimson/green palette reserved for critical insight highlights, and strictly functional iconography combine into a modular template library — Executive Title, Process Timeline, Comparison Matrix, Quantitative Data, and more — governed by a master slide grid for zero-deviation formatting.

Visual Hierarchy

Scale and weight direct the eye — controlling the exact sequence in which the audience absorbs information.

Grid Consistency

Unyielding alignment. Spatial predictability builds subconscious trust in the data's accuracy.

Accessibility & Contrast

If they cannot read it, the strategy does not exist — strict adherence to WCAG contrast ratios.

Visual Reasoning

Transforming text into conceptual frameworks — letting executives see the logic of the strategy, not just read it.

Full Deck

View the complete
capability deck.

Every slide from the source deck, viewable directly in your browser below.

If the deck doesn't render above, open it directly.

FAQ

Common questions
about this project.

What is the AI-Powered Executive Presentation System?

A human-in-the-loop presentation design methodology developed by Moor Graphix that combines AI-assisted research and layout with human strategic judgment and brand governance to produce board-ready executive decks.

Is the data in this deck real?

No. The Q3 revenue example and KPI figures shown in the deck are illustrative, built solely to demonstrate the before-and-after design methodology — not real client financials.

How does the human-in-the-loop process work?

AI handles research-heavy and layout-heavy tasks, while a human strategist and designer govern analysis, final recommendations, and brand application — ensuring AI accelerates production without sacrificing strategic nuance.

✦ Your Turn

Want your executive decks
rebuilt like this?

This capability demonstration shows how Moor Graphix's AI-assisted, human-in-the-loop system turns dense data into board-ready narratives. Let's build your next presentation.